Donald Trump State Approval Map: Latest Approval Ratings by State
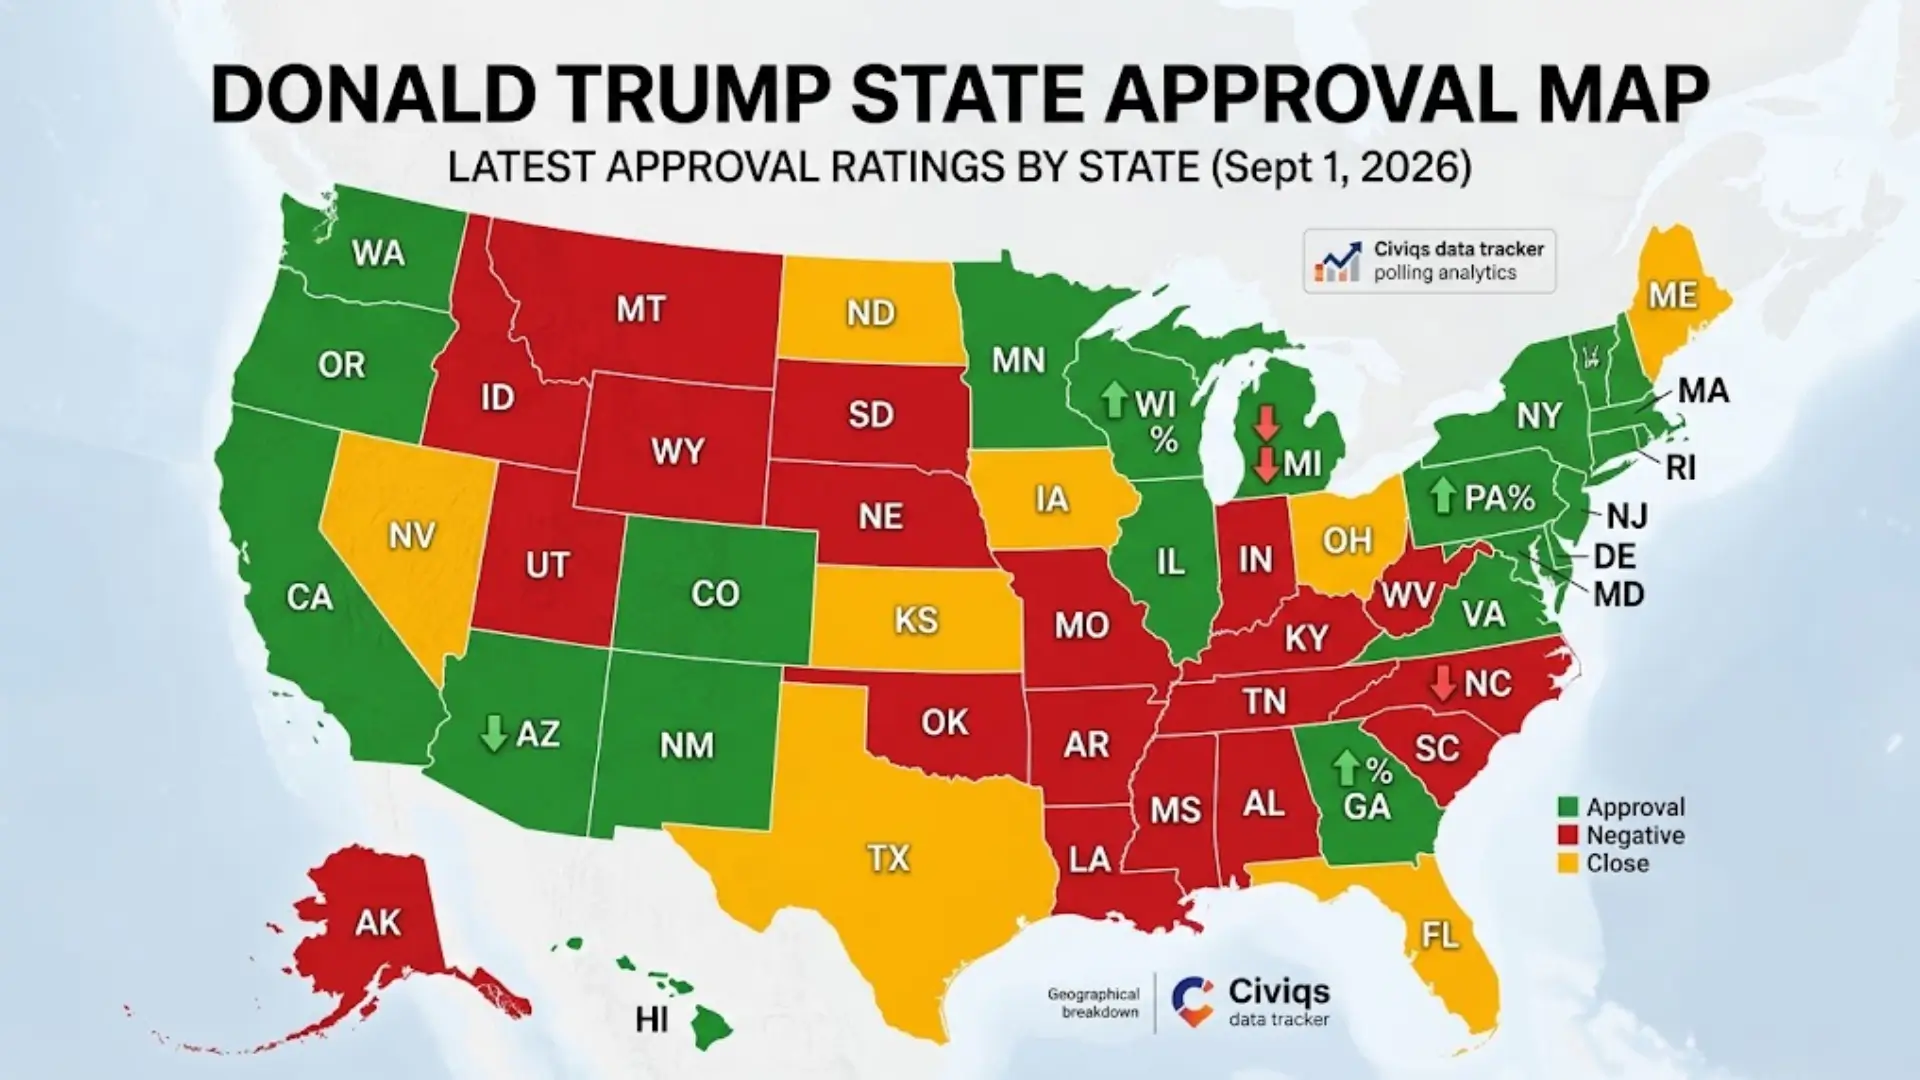
The Donald Trump state approval map provides a state-by-state look at how registered voters rate President Donald Trump’s job performance during his second term. Unlike a national approval number, a state map shows how opinions vary across different parts of the United States.
The latest complete 50-state snapshot located for this article comes from Civiqs data read on September 1, 2026. That tracker showed Trump at 35% approval and 59% disapproval nationally in its September 1 reading, with state results ranging from positive net approval in some states to substantially negative net approval in others.
National polling has continued to move since that state snapshot. A Reuters/Ipsos poll conducted in September found that 35% of Americans approved of Trump’s performance, up from 33% in the previous Reuters/Ipsos survey. The poll surveyed 1,143 Americans and reported a margin of error of 3 percentage points.
Because approval ratings are based on different samples, field dates, methodologies, and weighting systems, state-level figures should always be read with their polling source and date.
What Is the Donald Trump State Approval Map?
The Donald Trump state approval map is a visual representation of presidential job approval across all 50 states.
Instead of asking only whether Americans approve or disapprove of Trump nationally, state-level polling breaks the results down geographically. This makes it possible to see how the president’s approval numbers differ from one state to another.
For the Civiqs state snapshot used in this article, approval represents the percentage of respondents who said they approve of the way Trump is handling his job as president. Disapproval represents those who said they disapprove.
One commonly used measurement is net approval, calculated by subtracting the disapproval percentage from the approval percentage.
For example, if a state records 45% approval and 50% disapproval, its net approval is -5 percentage points.
That calculation describes the polling result. It does not measure voting intention or predict an election result.
Latest Trump Approval Rating by State
The table below uses the September 1, 2026 Civiqs state snapshot reported from the tracker. Figures are presented alphabetically rather than as a political ranking.
| State | Approval | Disapproval | Net Approval |
|---|---|---|---|
| Alabama | 48.3% | 42.2% | +6.1 |
| Alaska | 41.1% | 52.0% | -10.9 |
| Arizona | 38.8% | 54.5% | -15.7 |
| Arkansas | 49.9% | 43.4% | +6.6 |
| California | 25.1% | 70.1% | -45.0 |
| Colorado | 30.1% | 64.6% | -34.5 |
| Connecticut | 27.1% | 67.5% | -40.4 |
| Delaware | 30.4% | 63.8% | -33.4 |
| Florida | 42.0% | 52.9% | -10.9 |
| Georgia | 34.6% | 57.9% | -23.3 |
| Hawaii | 17.8% | 77.6% | -59.8 |
| Idaho | 49.9% | 42.8% | +7.1 |
| Illinois | 29.4% | 65.5% | -36.1 |
| Indiana | 46.3% | 46.9% | -0.7 |
| Iowa | 37.3% | 52.8% | -15.5 |
| Kansas | 48.3% | 44.5% | +3.8 |
| Kentucky | 39.8% | 49.1% | -9.3 |
| Louisiana | 44.0% | 48.0% | -4.0 |
| Maine | 29.1% | 64.3% | -35.2 |
| Maryland | 21.7% | 71.9% | -50.2 |
| Massachusetts | 24.5% | 70.7% | -46.2 |
| Michigan | 36.7% | 57.0% | -20.3 |
| Minnesota | 30.7% | 61.5% | -30.8 |
| Mississippi | 43.3% | 48.9% | -5.6 |
| Missouri | 41.4% | 51.9% | -10.5 |
| Montana | 51.2% | 42.6% | +8.7 |
| Nebraska | 45.1% | 46.9% | -1.8 |
| Nevada | 32.8% | 60.4% | -27.6 |
| New Hampshire | 28.6% | 64.4% | -35.8 |
| New Jersey | 29.7% | 65.7% | -35.9 |
| New Mexico | 32.8% | 61.6% | -28.8 |
| New York | 27.7% | 66.7% | -39.1 |
| North Carolina | 40.3% | 53.6% | -13.4 |
| North Dakota | 55.9% | 36.6% | +19.3 |
| Ohio | 37.6% | 55.7% | -18.1 |
| Oklahoma | 50.4% | 42.1% | +8.3 |
| Oregon | 27.5% | 67.4% | -39.9 |
| Pennsylvania | 37.3% | 55.6% | -18.3 |
| Rhode Island | 27.0% | 66.5% | -39.6 |
| South Carolina | 41.6% | 51.0% | -9.5 |
| South Dakota | 51.1% | 39.2% | +11.9 |
| Tennessee | 46.2% | 45.4% | +0.8 |
| Texas | 37.6% | 55.9% | -18.2 |
| Utah | 45.5% | 45.5% | -0.1 |
| Vermont | 20.1% | 74.4% | -54.3 |
| Virginia | 32.4% | 62.1% | -29.7 |
| Washington | 27.7% | 66.5% | -38.8 |
| West Virginia | 54.2% | 37.1% | +17.2 |
| Wisconsin | 39.0% | 55.4% | -16.4 |
| Wyoming | 51.6% | 39.4% | +12.3 |
The figures above come from the September 1 Civiqs state snapshot reported from the tracker, with net approval calculated as approval minus disapproval.
What Does the State Approval Map Show?
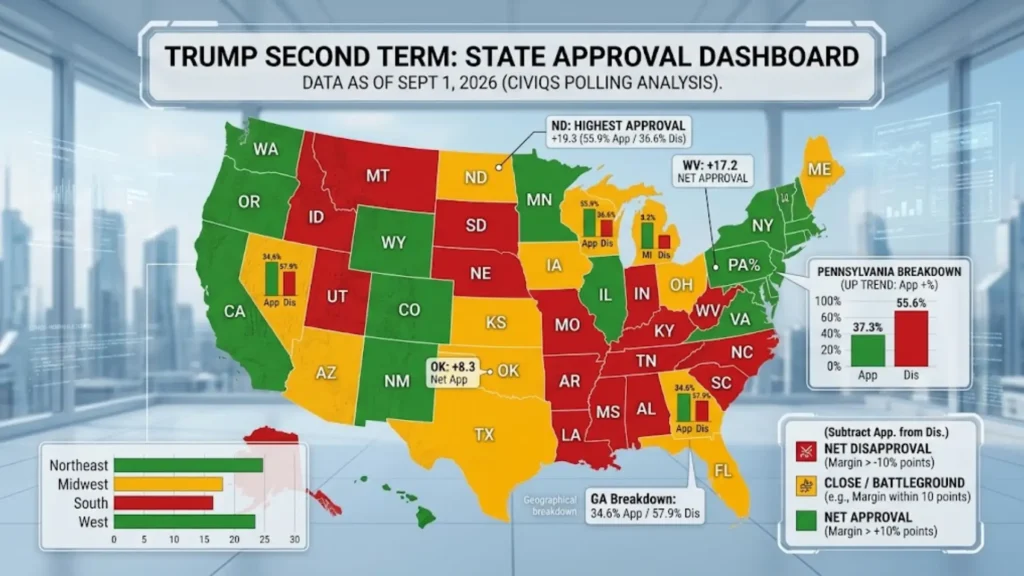
The map illustrates a wide geographic range in reported approval.
In the September 1 Civiqs snapshot, the reported approval figures ranged from 17.8% in Hawaii to 55.9% in North Dakota. Net approval ranged from -59.8 percentage points in Hawaii to +19.3 points in North Dakota.
Several states recorded approval above 50% in this particular snapshot, including North Dakota, West Virginia, Wyoming, South Dakota, Montana, and Oklahoma. Other states recorded approval close to the 50% mark, while many reported approval below 40%.
The map should therefore be read as a measurement of public opinion at a particular point in time rather than a permanent description of a state’s political preferences.
How Do the 2024 Battleground States Compare?
The Civiqs September 1 snapshot also provides data for states that were central to the 2024 presidential election.
The reported figures were:
| State | Approval | Disapproval | Net Approval |
|---|---|---|---|
| Arizona | 38.8% | 54.5% | -15.7 |
| Georgia | 34.6% | 57.9% | -23.3 |
| Michigan | 36.7% | 57.0% | -20.3 |
| Nevada | 32.8% | 60.4% | -27.6 |
| North Carolina | 40.3% | 53.6% | -13.4 |
| Pennsylvania | 37.3% | 55.6% | -18.3 |
| Wisconsin | 39.0% | 55.4% | -16.4 |
These figures describe presidential job approval among the surveyed population. They should not be interpreted as predictions of how those states would vote in a future election.
Approval polling and election polling answer different questions. Approval asks respondents to evaluate a president’s job performance, while an election poll asks about a particular candidate, race, or voting preference.
Why Are Trump Approval Ratings Different From One Pollster to Another?
One of the most important details when reading a Donald Trump state approval map is the polling organization behind the numbers.
Different pollsters can produce noticeably different national approval estimates even when their surveys are conducted around the same time.
For example, a Civiqs reading from August 19, 2026 showed 35% approval and 59% disapproval among registered voters. A Morning Consult national reading from August 17 showed 43% approval and 54% disapproval. The two surveys therefore produced substantially different net approval figures.
Morning Consult also has a state-level Trump approval page, but its widely circulated 50-state data were based on surveys conducted in September through November 2025 and the page was marked as updated in February 2026. That makes those figures unsuitable for presenting as a September 2026 state snapshot.
This is why a reliable state approval map should always include:
- The pollster
- The fieldwork dates
- The population surveyed
- The approval percentage
- The disapproval percentage
- The methodology when available
Without those details, two maps showing different numbers can appear contradictory even though they are measuring different survey samples.
What Is Trump’s Latest National Approval Rating?
National polling has continued to change after the September 1 Civiqs state snapshot.
A Reuters/Ipsos poll published September 14, 2026 found that 35% of Americans approved of Trump’s performance, compared with 33% in the previous Reuters/Ipsos poll conducted August 28 through 31. The September survey included 1,143 Americans and had a margin of error of approximately three percentage points.
The national figure is useful context, but it should not be substituted for the state figures in the map.
The national Reuters/Ipsos survey and the state-level Civiqs tracker use different polling systems. A state map should therefore retain the Civiqs figures as a separate dataset rather than combining them mathematically with the Reuters/Ipsos number.
Why State Approval Ratings Matter
State approval ratings can provide additional context that a national average cannot show.
A national figure combines respondents from every state into one measurement. That can conceal substantial geographic variation.
For example, the September Civiqs snapshot shows that approval and disapproval were nearly evenly divided in Utah, while the reported numbers were considerably different in states such as Hawaii and North Dakota.
State-level polling can also help researchers examine whether changes in public opinion are occurring across a broad geographic area or are concentrated in particular regions.
However, individual state numbers should not be overinterpreted. State samples can be smaller than national samples, and the uncertainty around a percentage can be significant, especially for less-populated states.
Approval Rating vs. Favorability: What Is the Difference?
Approval rating and favorability are related but different measurements.
A presidential job approval rating asks whether respondents approve or disapprove of how the president is handling the job.
A favorability rating generally asks whether respondents have a favorable or unfavorable opinion of the person.
These measurements can produce different results because someone can have a particular personal opinion about Trump while holding a different view of his performance as president.
For an article focused on the Donald Trump state approval map, job approval is the more relevant measure because it specifically evaluates presidential performance.
Does the Trump State Approval Map Predict the Midterm Elections?
No.
A presidential approval map is not an election forecast.
Approval ratings measure opinions about a president’s performance. Midterm election results depend on individual races, candidates, turnout, campaign activity, issues, congressional districts, Senate contests, and many other factors.
Reuters also noted that national generic-ballot polling does not capture all of the state-by-state and district-by-district factors that determine congressional control.
Therefore, the state approval numbers in this article should be treated as public-opinion measurements rather than predictions about the 2026 midterm elections.
How Often Does Trump’s State Approval Change?
Presidential approval can change as voters respond to new events, economic conditions, policy decisions, international developments, and other issues.
Civiqs uses rolling tracking, meaning its measurements can change as new survey responses are incorporated.
That creates an important distinction between a snapshot and a trend.
The September 1 state table represents a specific reading of the tracker. A later Civiqs reading could produce different percentages.
For this reason, anyone using the Donald Trump state approval map for research, journalism, or an updated article should check the field date before publishing the numbers.
Why the Date on a Trump Approval Map Matters
Polling numbers are time-sensitive.
A state approval map from early 2026 may look substantially different from one based on later polling. Treating an older map as current can give readers an inaccurate picture of public opinion.
This is especially important because Morning Consult’s state-level page has circulated online despite its state data being based on 2025 fieldwork.
For SEO content, the date should therefore appear prominently near the headline or introductory section.
A useful format is:
State approval snapshot: September 1, 2026
That immediately tells readers that the numbers represent a particular polling period.
Frequently Asked Questions
What is the latest Donald Trump state approval map?
The latest complete 50-state snapshot located for this article is based on Civiqs data read on September 1, 2026. The figures measure presidential job approval among registered voters and include approval, disapproval, and net approval for each state.
What is Trump’s national approval rating in September 2026?
A Reuters/Ipsos poll published September 14, 2026 found that 35% of Americans approved of Trump’s performance. That was up from 33% in the previous Reuters/Ipsos survey.
Which pollster provides the state-by-state figures?
The 50-state figures used in this article come from a Civiqs state approval snapshot dated September 1, 2026. The data are reported for registered voters.
What does net approval mean?
Net approval is calculated by subtracting the disapproval percentage from the approval percentage. For example, 45% approval and 50% disapproval produces a net approval rating of -5 percentage points.
Is approval rating the same as election support?
No. Approval measures how respondents evaluate presidential job performance. Election polling measures voting preferences for a particular election or candidate.
Why can two Trump approval maps show different numbers?
Different pollsters use different samples, fieldwork periods, recruitment methods, weighting systems, and methodologies. As a result, their estimates can differ even when surveys are conducted close together.
How often should the Trump state approval map be updated?
Because presidential approval changes over time, a state map should be updated whenever a newer, complete state-level dataset becomes available. The polling date should always be displayed alongside the numbers.
Can the state approval map predict the 2026 election results?
No. State approval ratings provide information about public opinion toward the president but do not constitute an election forecast.
Final Takeaway
The Donald Trump State Approval Map offers a useful way to examine how presidential job approval varies geographically. The September 1, 2026 Civiqs snapshot shows substantial differences among states, with approval ranging from the high teens to the mid-50s and net approval varying considerably across the country.
At the national level, more recent Reuters/Ipsos polling found Trump’s approval at 35% on September 14, showing why the date and polling source matter when discussing presidential approval.
The most important point for readers is to treat every map as a dated polling snapshot. Approval ratings are measurements of public opinion, not predictions of future election results, and different polling organizations can produce different estimates. Checking the pollster, field dates, methodology, and population surveyed provides the clearest way to understand what a Trump approval map actually shows.